Apple M4 Silicon chip rendered in 3D, floating against a dark space background with faint stars

Sysdash - Free Mac Menu Bar Monitor for Apple Silicon

Unbound Planet's Sysdash. A free native menu bar monitor for Apple Silicon. No cloud. No accounts.

Your machine. Your numbers.

Within nova, we make and use tools that return control to the user. A system monitor is exactly that kind of tool.

Every Mac ships with Activity Monitor. Nobody uses it. It is buried in Applications, it is a window you keep closing, and the moment you need a quick answer - how hot is this chip running, is that export eating RAM or GPU - you are three clicks away from finding out. Third-party monitors exist, many are good, but most of them want a subscription, an account, or they phone home.

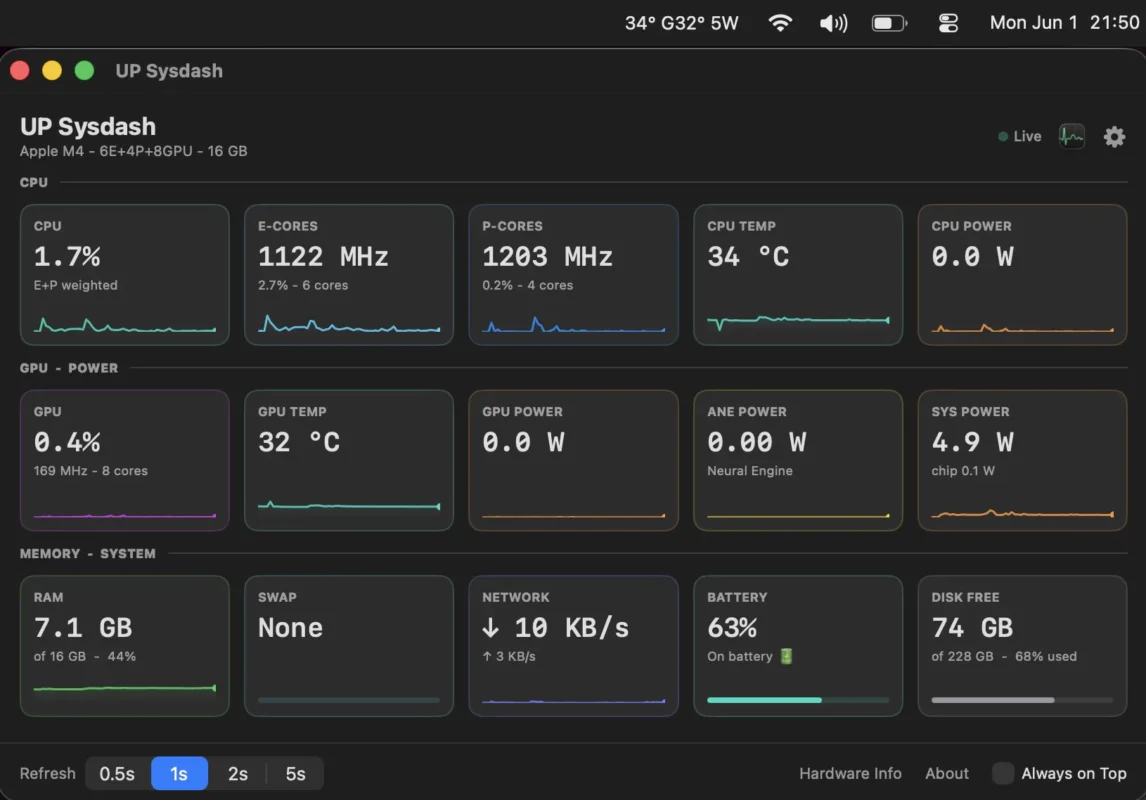
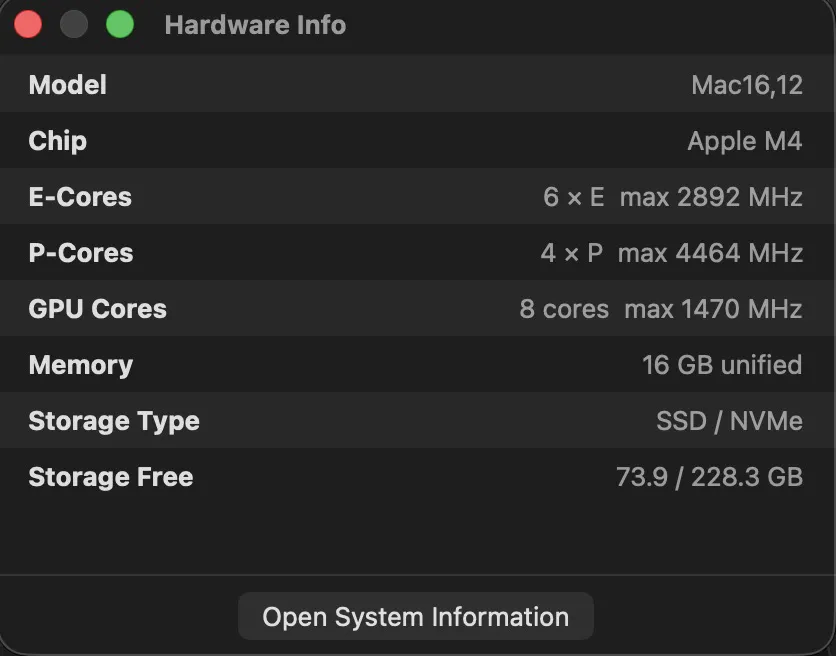
Sysdash does none of that. It is a free, native macOS app that lives in your menu bar and reads your Apple Silicon hardware in real time using macmon🔗 - an open-source tool that reads Apple Silicon performance counters directly from the chip. CPU, GPU, RAM, power draw, temperatures, network, battery. One click from your menu bar, nothing phoning home, nothing logged anywhere.

This is the install, the interface, and the settings - everything you need to get it running clean.

UP Sysdash - Full Release Download links

Everything is free with no ads. Consider supporting unboundplanet.com.

Buy Me a Coffee at ko-fi.com

SHA256f0b6c29df570fa8fe5d73799f822d880c08d2690132af4e0921c6a484adc859eCopied!  VirusTotal Report🔗

Expand allCollapse all

Part One: What It Is and Why It Exists

1.1) Nobody opens Activity Monitor
Apple's built-in answer is fine for troubleshooting, but you are not going to drag it out every time you want to check if your CPU is spiking during a render. It is a window. It requires switching apps, finding it, waiting for it to populate. A menu bar tool is always there - you look up, you know. That is the entire value proposition.

The third-party space for this is not empty - iStatMenus has existed for years and it is genuinely good. But it is a subscription. Stats (open-source, free) is excellent but ships with far more than most people use... modules, settings, and surface area that add up quickly if you just want the basics. Most others are either abandoned or cloud-connected in ways that don't need to be explained.

A project that I try to polish. Free, no accounts, no telemetry, MIT licensed. Apple Silicon only, as a focus. If you are on an M-chip Mac, this was built for that hardware specifically and reads it properly.

1.2) Why Apple Silicon specifically
The unified memory architecture changes what "monitoring" means on a Mac. CPU and GPU share the same physical memory pool. Power draw numbers that would be alarming on a PC mean something very different on an M-chip under load. The thermal envelope on an Air versus a Pro/Max behaves completely differently under sustained workloads.

Reading these properly requires a tool that understands the chip - not a generic CPU/RAM reader ported from x86. macmon, which Sysdash runs underneath, reads Apple Silicon performance counters through the same mechanism Apple's own Instruments uses. The numbers it gives you are real.

2.1) The engine
Sysdash does not read hardware itself. It runs macmon🔗 - a small open-source binary built by vladkens - as a background process and reads its JSON output. macmon is MIT licensed and does the actual hardware polling through Apple's IOKit and performance counter APIs. Sysdash is the interface layer: the menu bar, the dashboard, the settings.

The macmon binary ships inside the Sysdash app bundle. You do not install it separately. You do not need Homebrew. You open Sysdash, it starts macmon in the background, and data starts flowing.

2.2) What it can and cannot read
On Apple Silicon, macmon reads: E-core and P-core utilization and frequency, GPU utilization and frequency, ANE (Neural Engine) power, per-subsystem power draw, CPU and GPU temperatures, RAM usage and swap, and system-level power. This covers everything that matters for day-to-day monitoring.

What it does not cover: per-process attribution (that is what Activity Monitor is for), historical logging, alerts, or anything that requires elevated privileges. It shows you the state of your hardware... what you do with that information is yours.

Part Two: Install It

Download, drag, open. Two minutes.

1.1) Download
Either take it from the top of the page, or here🔗, or github🔗. Open it. You will see the Sysdash app and an Applications folder shortcut.

Drag Sysdash to Applications. Eject the disk image. That is the install. There is no installer wizard, no license click-through, no account creation step. The app is a self-contained bundle. Everything it needs is inside it.

1.2) Requirements
- macOS 12.4 Monterey or later
- Apple Silicon Mac (M1 or newer)
- Intel Macs: not supported. macmon reads Apple Silicon performance counters specifically - there is nothing to fall back on for Intel chips.

2.1) What happens when you open it
macOS will block the app on first open. You will see a message along the lines of "Sysdash cannot be opened because it is from an unidentified developer" or "this app has been blocked". This is Gatekeeper - Apple's system that checks whether an app has been signed and notarized with a paid Apple Developer certificate.

Sysdash does not have one. I am not going to pay Apple $99 per year to distribute a free app... honestly.

2.2) How to open it anyway
On macOS 15 Sequoia and later, the old right-click workaround is gone.

1. Try to open Sysdash from Applications. It will be blocked.
2. Open System Settings.
3. Go to Privacy & Security.
4. Scroll down. You will see a message about Sysdash being blocked.
5. Click "Open Anyway".
6. Authenticate with your admin password.

You do this once. After that, macOS remembers the exception and Sysdash opens normally.

2.3) On older macOS (pre-Sequoia)
On macOS 14 Sonoma and earlier, you can right-click the app in Finder and choose Open, then confirm in the dialog that appears. One time only, same result.

3.1) What appears
On first open, Sysdash shows two things: the main dashboard, and an onboarding window on top of it. The onboarding has one question: do you want it to start at login?

Enable it if you want Sysdash in your menu bar from the moment you log in after a restart. Disable it and you launch it manually when you want it. Either way, flip it any time afterward in Settings.

Press Get Started. The onboarding closes. Sysdash is running.

3.2) After the first run
After onboarding, Sysdash lives in your menu bar. The dashboard closes when you click elsewhere or click the menu bar stats again - it is a toggle. The stats item in the menu bar always stays visible as long as the app is running. If you enabled login item, it will be there after every restart without you doing anything.

Part Three: The Interface

Three ways in. One click, a right-click, and a dashboard.

1.1) What you see
By default the menu bar shows CPU usage. That is it. One number, always visible, always current. You can turn on more stats in Settings - GPU usage, CPU and GPU temperatures, RAM used, system power draw, battery percentage, and network up/down speeds.

Each enabled stat appears as a short label separated by whatever separator you choose: a hyphen, a pipe, a slash, or nothing. The label updates every second by default. You can set the refresh interval to 0.5s if you want it tighter, or 2-5s if you want it to barely move.

1.2) Click behavior
Left click: toggles the dashboard open and closed. If the dashboard is already visible, clicking the menu bar stats again hides it. Clean and fast.
Right click: opens a context menu with a live stats snapshot - CPU, GPU, temps, RAM, power, network, battery - plus links to Open Dashboard and Settings.

2.1) Layout
The dashboard is a single window divided into rows of metric cards. Each card shows a label, a current value, a small detail line, and either a live sparkline (a 60-sample history graph) or a progress bar.

The sections, in order:
- CPU - overall usage, E-core frequency and utilization, P-core frequency and utilization, CPU temperature, CPU power
- GPU / Power - GPU usage and frequency, GPU temperature, GPU power, ANE power, system power
- Memory / System - RAM used, swap, network down and up, battery, disk free

Every card is live. Values update at your chosen refresh interval. Sparklines show the last 60 samples so you can see whether a spike is ongoing or already fading.

2.2) The header bar
At the top of the dashboard: the chip name, core count, and memory (e.g. "M4 - 10 cores - 16 GB"). A green dot pulses to show macmon is running and data is live. If macmon goes offline for any reason, the dot turns red.

The header also has shortcuts to Activity Monitor (if you want per-process detail), Settings, and a Hardware Info panel that shows model identifier, exact core configs, storage type, and storage capacity.

2.3) Window behavior
The dashboard is resizable with a minimum size. Closing with the red X hides it rather than quitting the app - the menu bar stats stay live. Minimizing does the same. The app keeps running until you quit via the right-click menu or system shutdown. An "Always on Top" toggle in the bottom bar keeps the dashboard above other windows if you want it permanently visible.

3.1) Live snapshot
Right-clicking the menu bar stats gives you a quick-glance panel with the current values for everything - CPU, GPU, temps, RAM, power, network speeds, and battery. No need to open the full dashboard for a one-second check. This is the fastest path to an answer.

3.2) Actions in the menu
Below the stats snapshot:
- Open Sysdash - opens the dashboard
- Settings - opens the settings window directly
- Check for Updates - hits the GitHub releases API, tells you if a newer version exists
- Quit Sysdash - cleanly shuts everything down, including the macmon background process

Part Four: Settings

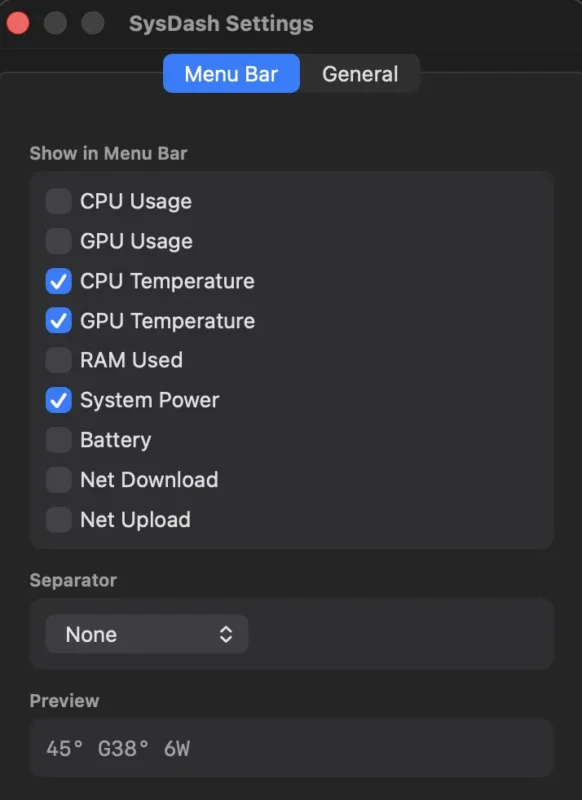
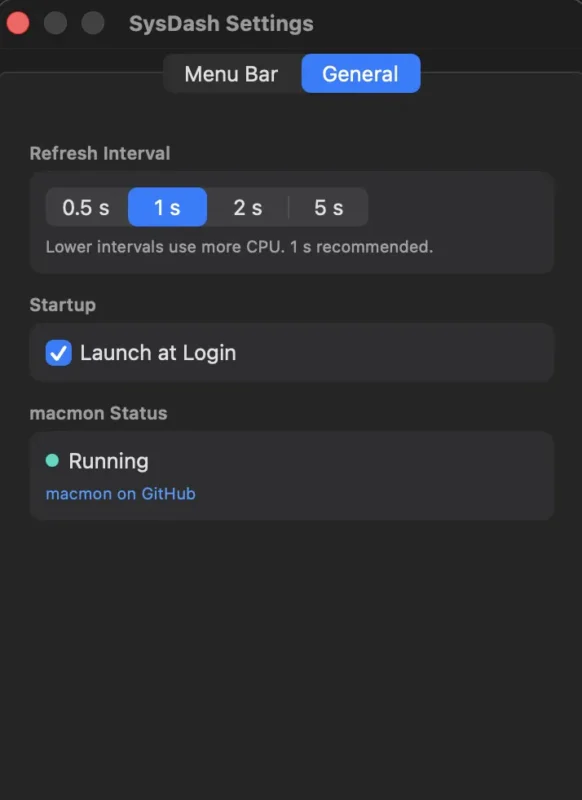
Two tabs. Everything you need to make it yours.

1.1) The toggles
The Menu Bar tab has a list of stats you can enable or disable independently:

- CPU Usage - on by default. Shows overall utilization as a percentage.
- GPU Usage - GPU utilization percentage
- CPU Temperature - average CPU die temperature in Celsius
- GPU Temperature - GPU temperature
- RAM Used - current RAM consumption in GB
- System Power - total chip power draw in watts
- Battery - percentage, with a charging indicator
- Net Download - current download speed in compact format (e.g. 1.2M, 500K)
- Net Upload - current upload speed

Enable as many or as few as your menu bar space allows. If all are off, the item shows "Sysdash" as a fallback label.

1.2) Separator
Choose how stats are separated when multiple are shown: hyphen (default), pipe, slash, or nothing (just a space). The preview at the bottom of the tab updates live as you toggle things on and off and change the separator, so you see exactly what the menu bar will look like before you commit.

2.1) Refresh interval
Four options: 0.5s, 1s (default), 2s, 5s. This controls how often macmon is polled and how frequently the dashboard and menu bar stats update. Faster intervals give you a more responsive picture of short spikes. Slower intervals use less CPU overhead - the difference is small but real if you are on battery and squeezing range.

1s is the right default for most use. 0.5s if you are actively watching a render or encode. 5s if the app is mostly just sitting in the background and you glance at it occasionally.

2.2) Launch at Login
Toggle this on and Sysdash registers itself as a login item using macOS's native SMAppService API. After a restart, it starts silently in the background with no dock icon, no splash screen, no window - just the menu bar stats appearing as your session loads. Toggle it off and it unregisters itself cleanly.

2.3) macmon status
A small status indicator shows whether macmon is running and its version. If something goes wrong with the background process - permissions issue, binary not found - the status shows it here and the dashboard goes offline (red dot in the header). The settings panel also links directly to the macmon GitHub page if you want to check for macmon updates independently.

Unbound Planet's Sysdash checks for updates silently three seconds after launch. If a newer version is available on GitHub, a dialog appears asking if you want to download it. You can also trigger a manual check any time via right-click > Check for Updates, or from the About window.

The check hits the GitHub releases API at github.com/theodor94/sysdash🔗. If an update exists, it opens the release page in your browser. Download the DMG, drag it over the old one. Done. No auto-installer, no background updater process - you stay in control of what lands on your machine.

Closing Transmission

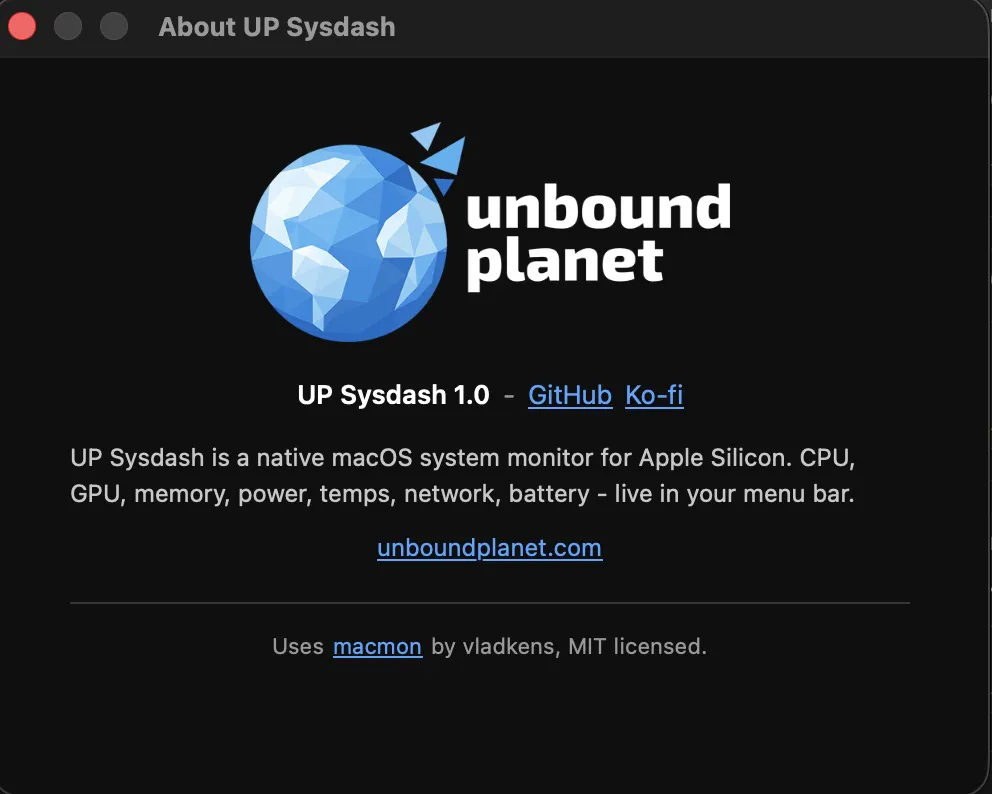
That is Unbound Planet's Sysdash. A menu bar app that reads your Apple Silicon hardware and shows you what your machine is doing. No subscriptions. No accounts. No data leaving your system. It runs macmon in the background - open source, MIT licensed, the same tool - and wraps it in a native SwiftUI interface that fits how you actually work.

The menu bar stats are always there. The dashboard opens with one click. The right-click menu gives you a full snapshot without even opening the window. Settings take two minutes to configure once and you never touch them again.

This is nova: fewer moving parts, no surprises, full ownership. A small tool that does one thing properly and gets out of the way.

Sysdash is MIT licensed. No source code is included in the release - reach out at unboundplanet.com🔗 if you want it. macmon is also MIT licensed and built by vladkens - give it a star if you use it.

Of course, much more is coming soon, so:
Stay tuned right here, on Unbound Planet, with your favorite host.
--Theo

Contact me🔗 for suggestions, feedback, ideas.